Economic Survey 2025-26
GST 2.0: Revenue Trends, Structural Reforms and Economic Impact
Introduction
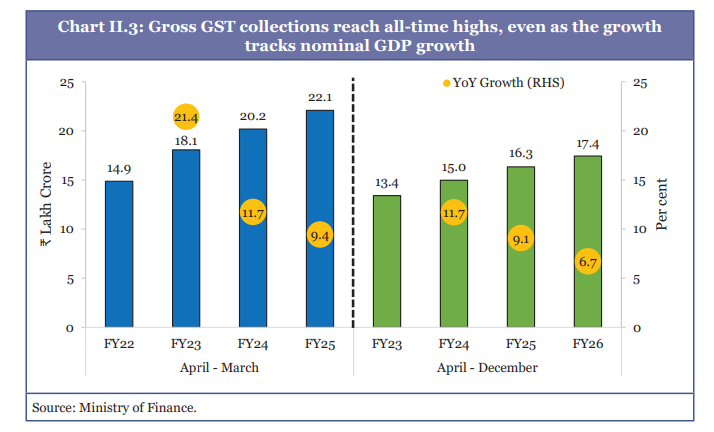
The Goods and Services Tax (GST) has emerged as a stabilising fiscal instrument, strengthening government revenues, deepening formalisation, and reinforcing the reform-oriented policy framework. During April–December 2025, gross GST collections reached ₹17.4 lakh crore, recording a 6.7% YoY growth, broadly aligned with nominal GDP growth conditions and moderated by lower inflation. Despite lower percentage growth, absolute collections have achieved multiple all-time highs, indicating sustained robustness.
GST Revenue Performance & Formalisation Trends
The underlying strength of GST is reflected in the expansion of the tax base, with registered taxpayers rising from ~60 lakh (2017) to over 1.5 crore, highlighting deeper formalisation of economic activity. High-frequency indicators reinforce this trend:
- E-way bill volumes grew by 21% YoY (Apr–Dec 2025)
- Rising transaction volumes indicate increased economic activity and compliance
GST growth has remained consistent with macroeconomic conditions, suggesting a structurally stable revenue system rather than inflation-driven gains.
GST Rate Rationalisation & Reform Architecture (GST 2.0)
The 56th GST Council meeting introduced a simplified tax structure:
- Standard Rate: 18%
- Merit Rate: 5%
- Demerit / Sin Rate: 40% (inclusive of earlier cess; no additional burden)
This reform (effective 22 September 2025) forms the third pillar of tax reforms, after:
- Corporate tax cuts (2019)
- Personal income tax reforms (April 2025)
The approach aims at simplification, demand stimulation, and compliance improvement.
Sector-wise GST Rate Changes
Agriculture & Allied Sector
- GST on tractors and farm machinery reduced to 5% (from 12%)
- Fertiliser inputs (Sulphuric acid, Nitric acid, Ammonia) cut to 5% (from 18%)
Automobile Sector
- Small cars, bikes ≤350cc, three-wheelers: 18% (from 28%)
- Buses, trucks, ambulances: 18% (from 28%)
- Uniform 18% GST on auto parts
- Luxury/high-end vehicles (>350cc) shifted to 40% slab, with cess removal
Electronics
- Items like ACs, large TVs, dishwashers, monitors reduced to 18% (from 28%)
Textiles & Labour-Intensive Goods
- Man-made fibres & yarn: reduced to 5%
- Handicrafts, marble, leather goods: reduced to 5% (from 12%)
Everyday Essentials & Food
- 5% GST on household goods (soap, shampoo, toothbrush, etc.)
- Zero GST on UHT milk, Indian breads, paneer
- Food items like namkeens, noodles, chocolates, coffee, ghee reduced to 5%
Healthcare
- Zero GST on select life-saving drugs
- Other medicines reduced to 5% (from 12%)
- Medical devices & equipment taxed at 5%
Services Sector
- Hotels (≤ ₹7,500/day): 5% GST (from 12%)
- Personal services (salons, gyms, yoga): 5% (from 18%)
Insurance
- Full GST exemption on individual life and health insurance policies
Economic Impact of GST Rationalisation
The reforms are expected to:
- Reduce cost of living by lowering tax burden on essentials
- Improve affordability and consumption demand
- Enhance price competitiveness and stimulate volume growth
- Strengthen compliance, offsetting revenue loss from lower rates
Sector-specific growth effects:
- Auto sector: Demand boost and manufacturing strength
- Real estate & infrastructure: Lower costs via reduced GST on construction inputs
- Healthcare: Improved access and domestic production
- MSMEs & exports: Support through lower taxes on labour-intensive goods
Climate & Sustainability Push
GST reforms also support environmental goals:
- GST on renewable energy equipment (solar, wind) reduced to 5%
- GST on biodegradable bags reduced to 5% (from 18%)
This promotes green mobility, renewable adoption, and waste management affordability, aligning with climate commitments.
Structural Reforms: Inverted Duty Structure (IDS)
GST 2.0 addresses the Inverted Duty Structure (IDS):
- Inputs taxed higher than outputs → increases cost burden & working capital stress
- Reforms include:
- Lower taxation of inputs/intermediates
- Higher rates on final consumption goods
- Correction in sectors like textiles and fertilisers
Residual issues are addressed through:
- Faster automated ITC refunds
- Potential future reforms:
- Refunds on capital goods and input services
High-Frequency Indicators Post-Reforms
Economic momentum strengthened (Sep–Dec 2025):
- Higher e-way bill generation
- Improved PMI (Manufacturing & Services)
- Record automobile sales during festive season
- Increased UPI transactions
- Rising tractor sales
These reflect strong demand recovery and economic activity.
GST & Logistics Transformation
The introduction of GST (2017) led to:
- Removal of inter-state check-posts
- Improved free movement of goods
- Reduced transit delays
The e-Way Bill system replaced physical checks, enabling:
- Digital tracking of goods movement
- Improved tax administration efficiency
Next Generation GST Reforms (Logistics & Compliance)
Future reforms aim to make GST more trust-based and technology-driven:
- Shift from enforcement to facilitation of logistics
- Introduction of “Trusted Dealer” framework:
- Minimal checks for compliant taxpayers
- Use of e-seals and electronic locking systems:
- End-to-end cargo tracking
- Integration with vehicle tracking technologies
Role of States:
- Move towards risk-based, system-generated checks
- Reduce discretionary inspections
Outcome:
- Reduced logistics costs and delays
- Non-intrusive tax administration
- Greater ease of doing business
Conclusion
GST 2.0 represents a comprehensive reform phase, combining rate rationalisation, structural correction, and digital governance. By strengthening formalisation, demand, compliance, and competitiveness, it supports economic growth momentum while aligning with Viksit Bharat 2047 vision.
NON-TAX REVENUE & NON-DEBT CAPITAL RECEIPTS: TRENDS AND REFORMS
Introduction
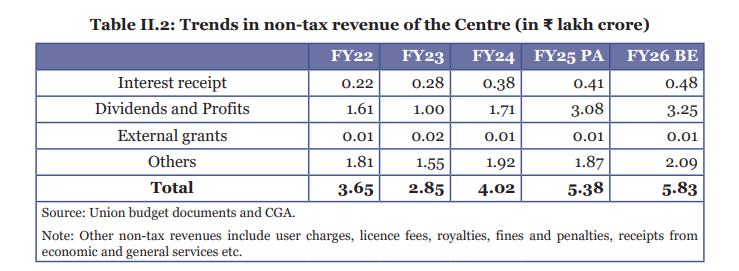
The non-tax revenues of the Central Government have shown stability at around 1.4% of GDP in the post-pandemic period, broadly in line with pre-pandemic levels, thereby providing consistent support to overall revenue receipts. This stability is primarily driven by a sharp rise in dividends and profits, along with improved performance of public sector institutions.
Growth in Dividends and Profits
The most significant driver of non-tax revenue has been the surge in dividends and profits, which have grown at over 70% annually in the last two years. This increase reflects:
- Higher surplus transfers from the RBI
- Improved financial performance of public sector banks and financial institutions
In FY26, the Reserve Bank of India (RBI) approved a surplus transfer of ₹2.68 lakh crore (for FY25), which is about 27% higher than ₹2.19 lakh crore transferred in the previous year.As a result:
- Non-tax revenues grew by 20.9% (Apr–Nov 2025)
- Achieved 88.6% of Budget Estimates within this period
Composition of Non-Tax Revenue
Within non-tax revenues, economic services form a major component, with key contributions from:
- Communication sector
- Roads and bridges
These sectors significantly contribute to the “other” non-tax revenue components, strengthening overall receipts.
Role of CPSEs in Revenue Generation
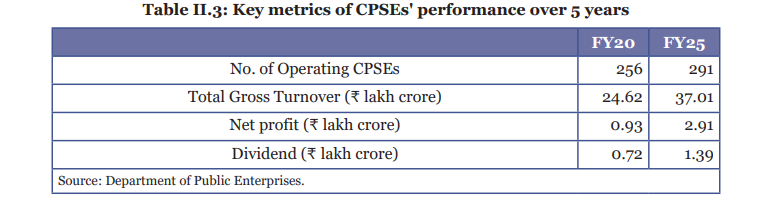
The improved performance of Central Public Sector Enterprises (CPSEs) has played a crucial role:
- Gross turnover per CPSE increased by ~32% (FY20–FY25)
- Net profits per CPSE rose by 174%
- Dividends per CPSE increased by 69%
This reflects:
- Enhanced operational efficiency
- Better capital management practices
Additionally, this growth helps protect minority shareholders’ interests, improving investor confidence.
Non-Debt Capital Receipts: Asset and Equity Monetisation
Non-debt capital receipts are significantly supported by disinvestment and asset monetisation efforts.
Disinvestment through OFS (FY26 till Dec 31, 2025)
- Three Offer for Sale (OFS)transactions:
- Mazagon Dock Shipbuilders Limited
- Bank of Maharashtra
- Indian Overseas Bank
- Total mobilisation: ₹7,717.02 crore
Other Components
- SUUTI remittances: ~₹1,051 crore
- InvIT-based monetisation: ₹18,837 crore
These reflect a market-based, valuation-driven disinvestment approach, aligned with minimum public shareholding norms.
Strategic Disinvestment Progress
Since 2016:
- 36 CPSEs received in-principle approval for strategic disinvestment
- 13 transactions completed
- Remaining at various implementation stages
In FY26:
- Approval for stake dilution/exit in select joint ventures
- Example: NTPC divestment from Utility Powertech Limited
Reforms also include:
- Empowering CPSE Boardsfor:
- Closure
- Merger
- Disinvestment of subsidiaries
Future Strategy for Equity Monetisation
To strengthen disinvestment receipts, several policy options are being considered:
Current Constraints
- In ~30% of listed CPSEs, Government shareholding is below 60%
- As per Companies Act, a government company requires ≥51% ownership
Policy Options
- Redefinition of Government Company
- Reduce minimum ownership to 26% (for listed CPSEs)
- Retain special resolution rights
- Enable greater equity monetisation
- Phased Disinvestment Strategy
- Continue OFS below 51% stake
- Move towards full privatisation without legal changes
- Post-Disinvestment Structure
- CPSEs to operate as:
- Professionally managed entities
- With dispersed ownership
- Ensuring transparent governance and succession
- CPSEs to operate as:
Recycling of Capital for Growth
A strategic approach involves:
- Channelising disinvestment proceeds into emerging sectors
- Investment through platforms like the National Investment and Infrastructure Fund (NIIF)
This ensures:
- Efficient capital recycling
- Support for innovation-driven and technology sectors
- Creation of a sustainable stream of future disinvestment receipts
Conclusion
Non-tax revenues have emerged as a stable and growing component of government finances, driven by RBI surplus transfers and CPSE performance. Simultaneously, disinvestment and asset monetisation are evolving into strategic fiscal tools, balancing revenue generation, efficiency, and long-term capital allocation.