Top 10 Richest States in India by GSDP and GDP per Capita (2024)
Top 10 Richest States in India by GSDP and GDP per Capita (2024)
Title: Economic Powerhouses of India – State-wise GDSP and GDP per Capita
Key Points:
- Overview:
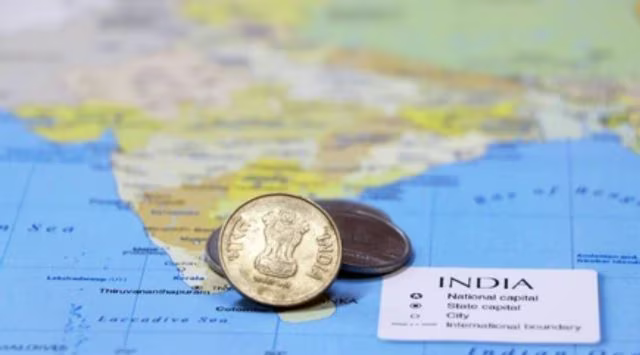
- India, the world’s fifth-largest economy, is projected to become the third-largest by 2030 with nominal GDP exceeding $7 trillion.
- FY24 GDP growth: 8.2%, higher than the government forecast of 7.3%.
- Indian states contribute variably to the national economy through GSDP (Gross State Domestic Product) and GDP per capita, reflecting economic diversity.
- Top 10 Richest States (2024) – GDSP & GDP per Capita:
| Rank | State | Projected GSDP FY24-25 (₹ Lakh Cr) | GDP per Capita FY22-23 (₹ Lakh) | State Share of National GDP (%) | Key Economic Features |
|---|---|---|---|---|---|
| 1 | Maharashtra | 42.67 | 2.89 | 13.3% | Financial hub, Mumbai: BSE/NSE, Reliance & Tata, film industry |
| 2 | Tamil Nadu | 31.55 | 3.50 (2023-24) | 8.9% | Automotive, textiles, IT industries (“Detroit of Asia”) |
| 3 | Karnataka | 28.09 | 3.31 | 8.2% | IT hub (Bengaluru), biotechnology, aerospace |
| 4 | Gujarat | 27.90 | 3.13 | 8.1% | Industrial & manufacturing base, port infrastructure |
| 5 | Uttar Pradesh | 24.99 | 0.96 | 8.4% | Agriculture-driven economy, emerging industrial corridors |
| 6 | West Bengal | 18.80 | 1.57 | 5.6% | Traditional industries, jute, tea, emerging IT and services |
| 7 | Rajasthan | 17.80 | 1.67 (2023-24) | 5% | Tourism, mineral-based industries, textiles |
| 8 | Telangana | 16.50 | 3.83 (2023-24) | 4.9% | IT hub (Hyderabad), pharmaceuticals, biotechnology |
| 9 | Andhra Pradesh | 15.89 | 2.70 | 4.7% | Agriculture, IT, industrial corridors |
| 10 | Madhya Pradesh | 15.22 | 1.56 (2023-24) | 4.5% | Agriculture, minerals, industrial development zones |
- Insights:
- Maharashtra leads in total GSDP due to financial and industrial concentration but Telangana has the highest GDP per capita (3.83 lakh).
- Uttar Pradesh shows high total GSDP (24.99 lakh cr) but low per capita GDP (0.96 lakh), indicating population pressure.
- Southern states like Tamil Nadu, Karnataka, Telangana, Andhra Pradesh dominate in per capita wealth due to industrialisation and IT growth.
- The economic profile reflects regional disparities: high GSDP states may not always have high per capita income.
Updated - February 21, 2025 07:45 AM | Indian Express